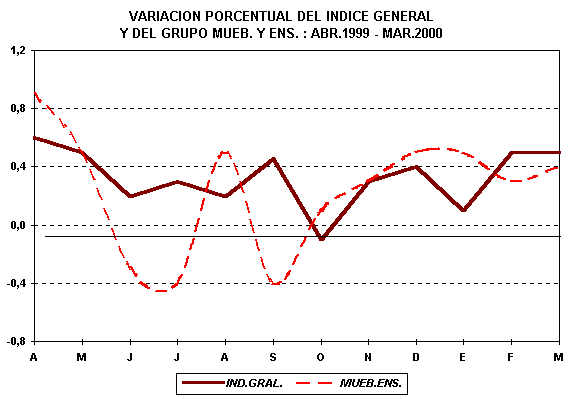


|
|
MES |
V A R I A C I O N P O R C E N T U A L |
||||
|
MENSUAL |
ACUMULADA |
TRIMESTRAL |
SEMESTRAL |
ANUAL 1/ |
|
| 1998 | |||||
|
NOVIEMBRE |
0,6 |
7,9 |
1,8 |
4,0 |
8,6 |
|
DICIEMBRE |
0,5 |
8,5 |
1,7 |
3,5 |
8,5 |
|
1999 |
|||||
|
ENERO |
0,8 |
0,8 |
1,9 |
3,5 |
8,5 |
|
FEBRERO |
0,5 |
1,3 |
1,8 |
3,6 |
8,5 |
|
MARZO |
0,4 |
1,7 |
1,7 |
3,5 |
8,2 |
|
ABRIL |
0,9 |
2,7 |
1,9 |
3,8 |
8,1 |
|
MAYO |
0,5 |
3,1 |
1,8 |
3,6 |
7,8 |
|
JUNIO |
-0,3 |
2,9 |
1,1 |
2,9 |
6,4 |
|
JULIO |
-0,4 |
2,4 |
-0,3 |
1,6 |
5,2 |
|
AGOSTO |
0,5 |
2,9 |
-0,2 |
1,6 |
5,3 |
|
SETIEMBRE |
-0,4 |
2,5 |
-0,4 |
0,7 |
4,2 |
|
OCTUBRE |
0,1 |
2,6 |
0,2 |
-0,1 |
3,7 |
|
NOVIEMBRE |
0,3 |
2,9 |
0,0 |
-0,2 |
3,4 |
|
DICIEMBRE |
0,5 |
3,4 |
0,9 |
0,5 |
3,4 |
|
2000 |
|||||
|
ENERO |
0,5 |
0,5 |
1,2 |
1,4 |
3,1 |
|
FEBRERO |
0,3 |
0,8 |
1,2 |
1,2 |
2,8 |
|
MARZO |
0,4 |
1,1 |
1,1 |
2,0 |
2,8 |
|
1/ Respecto al mismo mes del año anterior. |
|||||
